About CGGA database
- Overview
- Clinical specimen collection
- Image-genomic data
- Single-cell sequencing data
- Whole-exome sequencing (WEseq) data
- mRNA sequencing (mRNA-seq) data
- mRNA microarray (mRNA-array) data
- methylation microarray (methyl-array) data
- microRNA microarray (miRNA-array) data
- Identification of IDH mutation and 1p/19q co-deletion
- Multi-dimensional genomic data
Overview
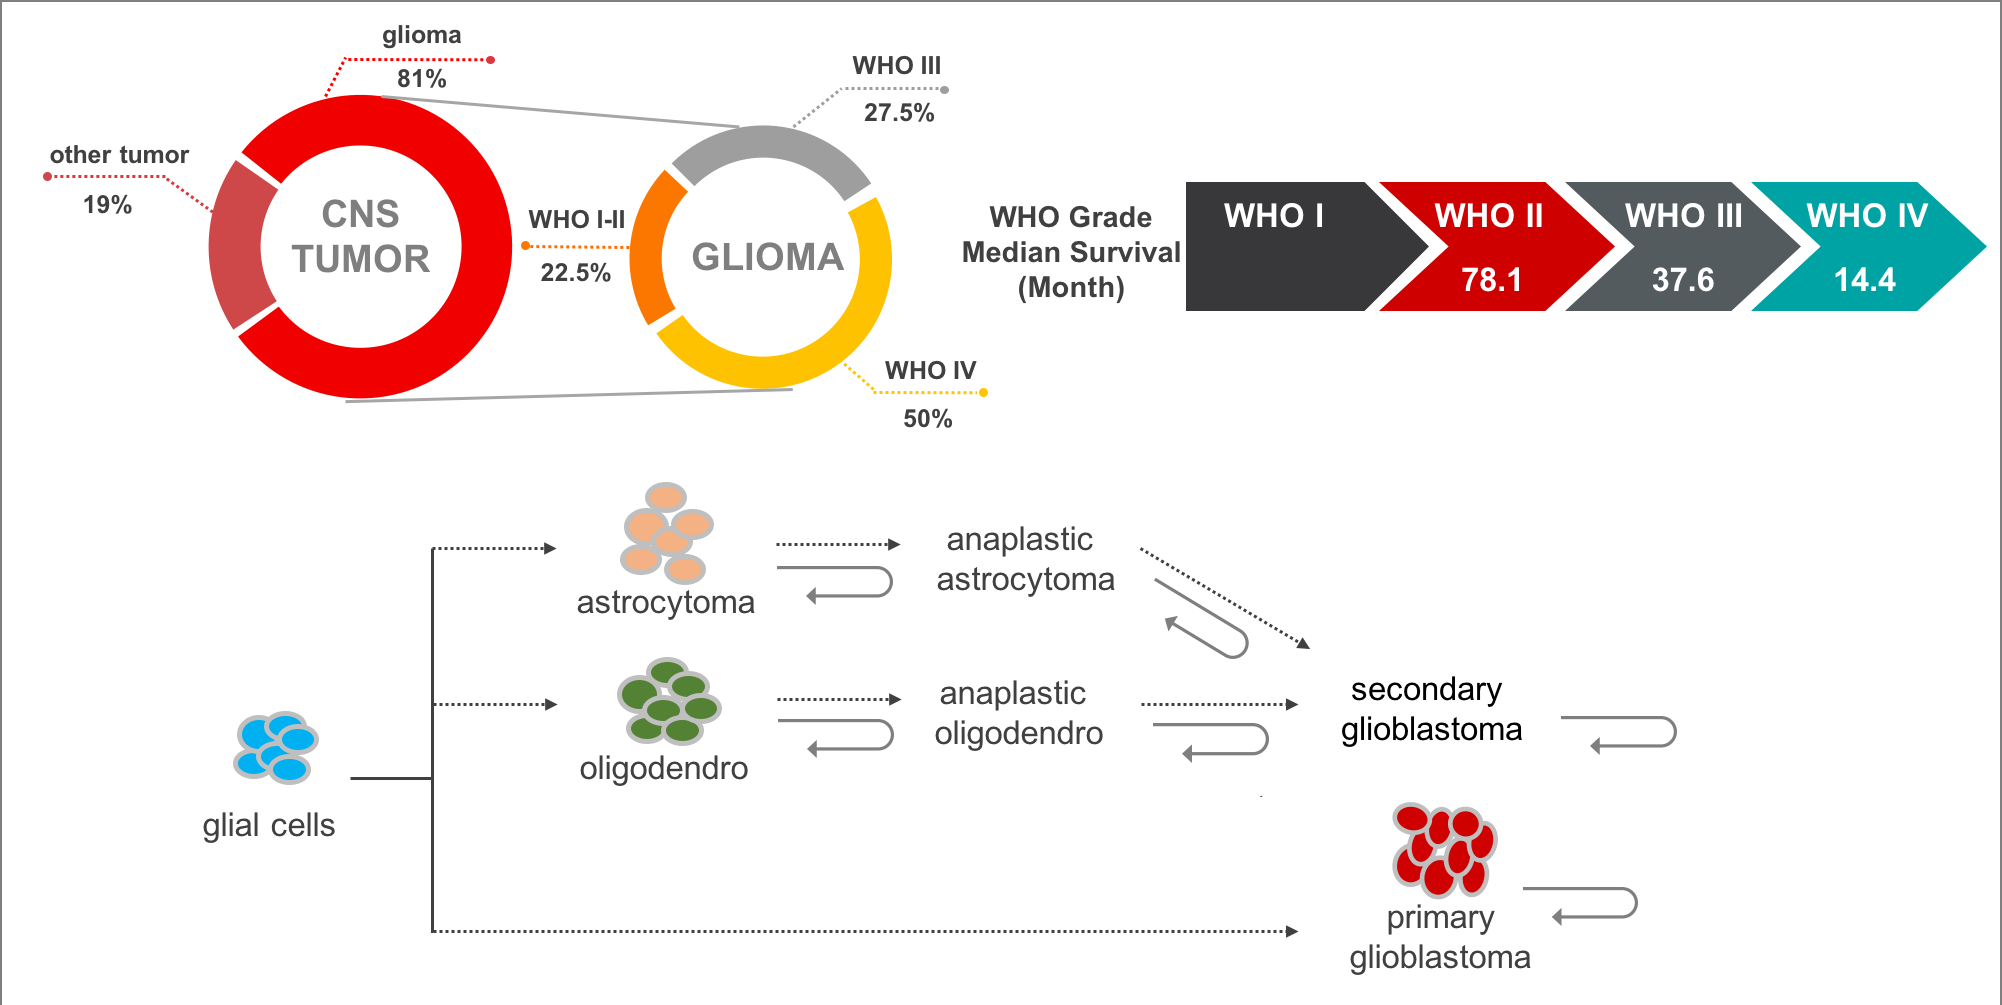
Gliomas are the most common and lethal type of primary malignant central nervous system (CNS) tumors with an extremely poor prognosis. It comprises about 30 percent of all brain tumors and central nervous system tumors, and 80 percent of all malignant brain tumors. According to the World Health Organization (WHO) classification of tumors of the CNS, malignant adult diffused gliomas are classified into grades II to IV based on histologic features. In the 2016 edition, gliomas were subdivided into more subtypes that utilized molecular features such as 1p/19q codel, IDH mutation, etc. In addition, most of lower grade glioma (grade II and III, LGG) will progress to high grade glioma (grade IV, also called glioblastoma multiforme, GBM), while GBMs can be further classified into primary GBM (pGBM) and secondary GBM (sGBM).
At present, the mechanism of glioma recurrence or malignant progression may be as follows:
- The infiltrative tumor cells cannot be completely removed by neurosurgical resection.
- The retain tumor cells cannot be effectively suppressed by limit postoperative treatment options.
- The multiple lesions may develop alternately.
- The rapid cell cloning revolution under chemotherapy and/or radiotherapy
- Tumor cells is allowed in the adaptive tumor microenvironment
- Limited research due to limited data resources
Therefore, we believe that a glioma-related database development, especially focusing on recurrent glioma, can greatly help explore the pathogenesis and recurrence mechanism of glioma. Back in 2004, under the guide of Academician Zhongcheng Wang, the first comprehensive glioma center was built in China, named as the Center of Brain Tumor (CBT). Prof. Tao Jiang was appointed director of the CBT and his research mainly focuses on translational medicine, molecular classification, precise treatment for glioma. Through nearly ten years' sample collection, Prof. Tao Jiang's team has built the largest glioma tissue bank with particular follow-ups in China. In 2012, Prof. Jiang and his team established the Chinese Glioma Genome Atlas (CGGA), which will provide massive amounts of data for the research both in basic and clinical research of gliomas. This project aims to:
- Provide Multi-omics Chinese Glioma Resources
- Identify Novel Glioma Genomic Alterations
- Develop Glioma Image-Genomic Omics
- Explore Glioma Immuno- Neuro-Oncology
- Develop Artificial Intelligence for Glioma Diagnosis and Intervention
So far, more than 100 SCI papers have been published and more than 20 projects have been applied by using this database directly or indirectly. Currently, this database contains multiple 'Omics' data in glioma on Chinese cohorts over 2,000 samples (Table 1). Besides, we have also developed analysis tool to allows users to browse mutation landscape profile, mRNA/microRNA expression profile and DNA methylation profile, and to do survival and correlation analysis in specific glioma subtype.
Table 1. The dataset statistics in CGGA database.
| ID | Dataset | Sample Type | #Sample |
|---|---|---|---|
| Dataset 1 | WEseq_286 | Primary LGG, Recurrent LGG, Primary GBM, Recurrent GBM | 286 |
| Dataset 2 | mRNAseq_693 | Primary LGG, Recurrent LGG, Primary GBM, Recurrent GBM | 693 |
| Dataset 3 | mRNAseq_325 | Primary LGG, Recurrent LGG, Primary GBM, Recurrent GBM, Secondary GBM | 325 |
| Dataset 4 | mRNA-array | Primary LGG, Recurrent LGG, Primary GBM, Recurrent GBM, Secondary GBM | 301 |
| Dataset 5 | methyl_159 | Normal, Primary LGG, Recurrent LGG, Primary GBM, Recurrent GBM, Secondary GBM | 159 |
| Dataset 6 | microRNA_198 | Primary LGG, Recurrent LGG, Primary GBM, Recurrent GBM, Secondary GBM | 198 |
Clinical specimen collection
Glioma tissues, the corresponding genomic data and the patients' follow-up information (histology, gender, age, WHO grade, overall survival and censor status, etc.) were obtained from the Chinese Glioma Genome Atlas (CGGA, including patients treated at Beijing Tiantan Hospital, Sanbo Hospital in Beijing, Tianjin Medical University General Hospital, The First Affiliated Hospital of Nanjing Medical University, Harbin Medical University, China Medical University). All research performed was approved by the Tiantan Hospital Institutional Review Board (IRB) and kept consistent with the principles of the Helsinki Declaration. All the subjects were diagnosed with gliomas by consensus, according to central pathology reviews by independent board-certified neuropathologists and further graded based on the 2007/2016 WHO classification. Written informed consent was obtained from all patients. The specimens were collected under IRB KY2013-017-01 and were frozen in liquid nitrogen within 5 min of resection.
Image-genomic data
Preoperative MRI image data of Two hundred and seventy-four glioma patients who were treated at the Beijing Tiantan Hospital from August 2005 to August 2012 were collected retrospectively. Among them, transcriptome sequencing of 167 patients’ tumors was performed. More MRI image data of glioma patients were consecutively enrolled from Nov. 2016 to this day. The tumor region of interest (ROI) of all patients were segmented. T2-weighted MR images were used for the extraction of radiomics features, as these images are well accepted in the identification of abnormal hyperintense signals that represent the involved regions of low-grade gliomas. Hyperintense signals on the T2-weighted images were regarded as tumor areas. The Dice coefficient was used to measure the discrepancy between tumor masks, and a senior neuroradiologist made a final decision about the tumor border when the discrepancy was more than 5%.
Single-cell sequencing data
Peri-operative T1+gadolinium and FLAIR (fluid attenuated inversion recovery) sequences enable the objective discrimination of the gadolinium-enhanced (CE) tumor core, nonenhanced (NE) areas, and FLAIR hyperintense tissue at the tumor margins (edema). Multiple (3–8) random MRI-localized (CE, NE, edema) biopsies measuring ∼1.0 cm×0.5 cm×0.5 cm and at least 10 mm apart were planned before surgical debulking. During the operation, we used the Brainlab Neuronavigation interface (Brainlab) to guide the biopsy and confirm the planned radiographic localization. Specimens from each region were divided in two: one piece was immediately flash frozen in liquid nitrogen, and the other piece was used for single-cell preparation. Immediately after sample collection, the tumors were washed with phosphate-buffered saline (PBS), fully dissociated and subjected to enzymatic dissociation with trypsin-EDTA solution. Following filtrating through a cell strainer and red blood cell lysis, the cell suspensions were used for single-cell isolation. Single-cell RNA-seq libraries were constructed following the STRT-seq protocol. KAPA Hyper Prep Kits (KK8505) was used for library construction. The library amplification primers were an Illumina QP2 primer (5′-CAAGCAGAAGACGGCATACGA-3′) and a short universal primer (5′-AATGATACGGCGACCACCGAGATCTACACTCTTTCCCTACACGAC-3′). The libraries were sequenced on Illumina HiSeq 4000 platform to generate 150-bp paired-end reads. Finally, 73 surgically obtained biopsies from 14 patients were used for single cell sequencing.
Whole-exome sequencing (WEseq) data
Genomic DNA from the tumor and the matched blood sample was extracted and confirmed for high integrity by 1% agarose gel electrophoresis. The DNA was subsequently fragmented, quality-controlled, and then pair-end libraries were prepared. For whole exome sequencing, Agilent SureSelect kit v6 was used for target capture. Sequencing was done on Illumina Hiseq platform using 150 bp pair-end sequencing strategy.
Mapping and mutation calling: Valid DNA sequencing data were mapped to the reference human genome (UCSC hg19) using Burrows-Wheeler Aligner (v0.7.12-r1039, bwa mem, Li et al. 2009) with default parameters. Then, SAMtools (v1.2, Li et al. 2009) and Picard (v2.0.1, Broad Institute) (http://broadinstitute.github.io/picard/) were used to sort the reads by coordinates and mark duplicates. Statistics such as sequencing depth and coverage were calculated based on the resultant BAM files. SAVI2 was used to identify somatic mutations (including single nucleotide variations and short insertion/deletions) as previously described (Wang et al., 2016; Hu et al., 2018). In this pipeline, SAMtools mpileup and bcftools were used to perform variant calling, then the preliminary variant list was filtered to remove positions with no sufficient sequencing depth, positions with only low-quality reads, and positions that are biased toward either strand. Somatic mutations were identified and evaluated by an Empirical Bayesian method. In particular, mutations with the mutation allele frequency in tumors significantly higher than that in normal control were selected.
bwa mem -t 16 <ref_dir>/hg19.fa \
<sample_blood>_1.fq.gz <sample_blood>_2.fq.gz  \
| samtools view -@ 16 -Shb -o <sample_blood>.bam
samtools sort -@ 16 <sample_blood>.bam \
<sample_blood>.sorted
picard MarkDuplicates INPUT=<sample_blood>.sorted.bam \
OUTPUT=<sample_blood>.sorted.dedup.bam \
METRICS_FILE=<sample_blood>.metrics.txt
picard BuildBamIndex I=<sample_blood>.sorted.dedup.bam \
O=<sample_blood>.sorted.dedup.bam.bai

bwa mem -t 16 <ref_dir>/hg19.fa \
<sample_tissue>_1.fq.gz <sample_tissue>_2.fq.gz  \
| samtools view -@ 16 -Shb -o <sample_tissue>.bam
samtools sort -@ 16 <sample_tissue>.bam \
<sample_tissue>.sorted
picard MarkDuplicates INPUT=<sample_tissue>.sorted.bam \
OUTPUT=<sample_tissue>.sorted.dedup.bam \
METRICS_FILE=<sample_tissue>.metrics.txt
picard BuildBamIndex I=<sample_tissue>.sorted.dedup.bam \
O=<sample_tissue>.sorted.dedup.bam.bai

<savi_dir>/savi.py --memory 16 --superverbose
--bams <sample_blood>.sorted.dedup.bam,\
<sample_tissue>.sorted.dedup.bam \
--names NORMAL,TUMOR
--ref <ref_dir>/hg19.fa \
--outputdir <sample_dir>
mRNA sequencing (mRNA-seq) data
mRNA sequencing: Prior to library preparation, total RNA was isolated using RNeasy Mini Kit (Qiagen) according to the manufacturer’s instructions. Pestle and QIAshredder (Qiagen) were used to disrupt and homogenize frozen tissue. The RNA intensity was checked using a 2,100 Bioanalyzer (Agilent Technologies) and only high-quality samples with an RNA Integrity Number (RIN) value greater than or equal to 6.8 were used to construct the sequencing library. Typically, 1 μg of total RNA was used with the TruSeq RNA library preparation kit (Illumina) in accordance with low-throughput protocol, except that SuperScript III reverse transcriptase (Invitrogen) was used to synthesize first strand cDNA. After PCR enrichment and purification of adapter-ligated fragments, the concentration of DNA with adapters was determined with quantitative PCR (Applied Biosystems 7,500) using primers QP1 5′-AATGATACGGCGACCACCGA-3′ and QP2 5′-CAAGCAGAAGACGGCATACGAGA-3′. The length of the DNA fragment was measured using a 2,100 Bioanalyzer, with median insert sizes of 200 nucleotides. Then, RNA-seq libraries were sequenced using the Illumina HiSeq 2,000/2,500/4,000 Sequencing System. The libraries were prepared using the paired-end strategy with the read length of 101 bp, 125bp or 150 bp. Base-calling was performed by the Illumina CASAVA v1.8.2 pipeline.
Mapping and Quantification: RNA-seq mapping and quantification were processed by using STAR (v2.5.2b, Dobin et al., 2012) and RSEM (v1.2.31, Li et al., 2011) software. Briefly, the reads were aligned to the human genome reference (GENCODE v19, hg19) with STAR, and then sequencing read counts for each GENCODE gene were calculated using RSEM. The expression levels of different samples were merged into a FPKM (fragments per kilobase transcriptome per million fragments) matrix. We define an expressed gene only if its expressed level is larger than 0 at half of samples. Finally, we only retain the expressed genes in mRNA expression profile. The details are described as below:
RNA-Seq Alignment Workflow: The mRNA Analysis pipeline begins with the alignment workflow by using STAR (v2.5.2b). For each RNA-seq sample, STAR aligns each read group to human reference genome (GENCODE v19, hg19) separately and then merges the resulting alignments into one. This workflow outputs a BAM file, which contains both aligned and unaligned reads (controlled data).
STAR
--outFileNamePrefix <outFileNamePrefix>
--runThreadN 10
--genomeDir <genomeDir>
--genomeLoad NoSharedMemory
--readFilesIn <fastq_left_1> <fastq_right_2>
--readFilesCommand zcat
--limitBAMsortRAM 0
--outSAMtype BAM SortedByCoordinate
--outSAMstrandField intronMotif
--outSAMattributes NH HI NM MD AS XS
--outSAMunmapped Within
--outSAMheaderHD \@HD VN:1.4
--outFilterMultimapNmax 20
--outFilterMultimapScoreRange 1
--outFilterScoreMinOverLread 0.33
--outFilterMatchNminOverLread 0.33
--outFilterMismatchNmax 10
--alignIntronMax 500000
--alignMatesGapMax 1000000
--alignSJDBoverhangMin 1
--sjdbOverhang 100
--sjdbScore 2
--quantMode TranscriptomeSAM GeneCounts
RNA-Seq Quantification: After mapping reads to
human genome (GENCODE v19, hg19), we then quantify the
gene/transcript expression level from RNA-seq data with using RSEM
software (v1.2.31).
rsem-calculate-expression
--paired-end --strandedness none
-p 8 --alignments
--no-bam-output
<bam_file>
<genome_rsem_dir>
<RSEM_out_dir_prefix>
mRNA microarray (mRNA-array) data
RNA extraction: All tissue samples were immediately snap-frozen in liquid nitrogen after surgery. A hematoxylin and eosin–stained frozen section was prepared from each sample to assess the percentage of tumor cells before RNA extraction. Only samples with 80% tumor cells were selected for RNA extraction. Total RNA from frozen tumor samples was extracted using the mirVana miRNA Isolation kit (Ambion) according to the manufacturer’s protocol. RNA concentration and quality were measured using the NanoDrop ND-1000 spectrophotometer (NanoDrop Technologies).
Whole genome gene profiling: Microarray analysis was performed on all samples using the Agilent Whole Human Genome Array according to the manufacturer’s instructions. The integrity of total RNA was checked using an Agilent 2100 Bioanalyzer (Agilent). cDNA and biotinylated cRNA were synthesized and hybridized to the array. Data were acquired using the Agilent G2565BA Microarray Scanner System and Agilent Feature Extraction Software (version 9.1). Probe intensities were normalized using GeneSpring GX 11.0.
Methylation microarray (methyl-array) data
DNA extraction: All of the tissue samples were immediately snap-frozen in liquid nitrogen after surgery. A hematoxylin and eosin-stained frozen section was prepared for assessment of the percentage of tumor cells before RNA extraction. Only samples with greater than 80% tumor cells were selected. Genomic DNA was isolated from frozen tumor tissues using the QIAamp DNA Mini Kit (Qiagen) according to the manufacturer’s protocol. DNA concentration and quality were measured using the NanoDrop ND-1000 spectrophotometer (NanoDrop Technologies, Houston, TX).
Genome-wide DNA methylation profiling: We used the Illumina Infinium HumanMethylation27 Bead-Chips (Illumina Inc.). The BeadChip contains 27,578 highly informative CpG sites covering more than 14,000 human RefSeq genes. This allows researchers to interrogate all of these sites per sample at a single nucleotide resolution. Bisulfite modification of DNA, chip processing and data analysis were performed following the manufacturer’s manual at the Wellcome Trust Centre for Human Genetics Genomics Lab, Oxford, UK. The array results were analyzed with the BeadStudio software (Illumina).
microRNA microarray (miRNA-array) data
Total RNA (tRNA) was extracted from frozen tissues by using the mirVana miRNA Isolation Kit (Ambion, Inc., Austin, Tex), and its concentration and quality were determined with the NanoDrop ND-1000 spectropho- tometer (NanoDrop Technologies, Wilmington, Del). The miRNA expression profiling was performed using the human v2.0 miRNA Expression BeadChip (Illumina, Inc., San Diego, Calif) with 1146 miRNAs covering 97% of the miRBase 12.0 database according to the manufacturer’s instructions.
Identification of IDH mutation and 1p/19q co-deletion
For IDH1/2 (IDH) mutation status, we detected the IDH mutation status based on reads over hotspot mutation position. Briefly, the WES or RNA-seq sequencing reads was aligned to the human reference genome. And then, the reads supporting mutation at chr2:209113112 (IDH1), chr2:209113113 (IDH1) and chr15:90631838 (IDH2) positions were counted to determinate the IDH mutation status.
For 1p/19q co-deletion (codel) status, we predicted 1p/19q status using gene expression according to the Hu et al.'s method (Hu et al. 2017, Neuro-Oncology). First, we obtained the scaled gene expression profile in which genes located on 1p and 19q sorted by genomic locations. Then, we used a sliding 100 gene window to smooth 1p and 19q expression levels. Finally, we used a cluster method to determinate the 1p and 19q co-deletion status.
Multi-dimensional genomic data
There were 283 samples for WES, 325 samples for RNAseq and 693 samples for RNAseq, among which 231 samples overlapped with WES and RNAseq.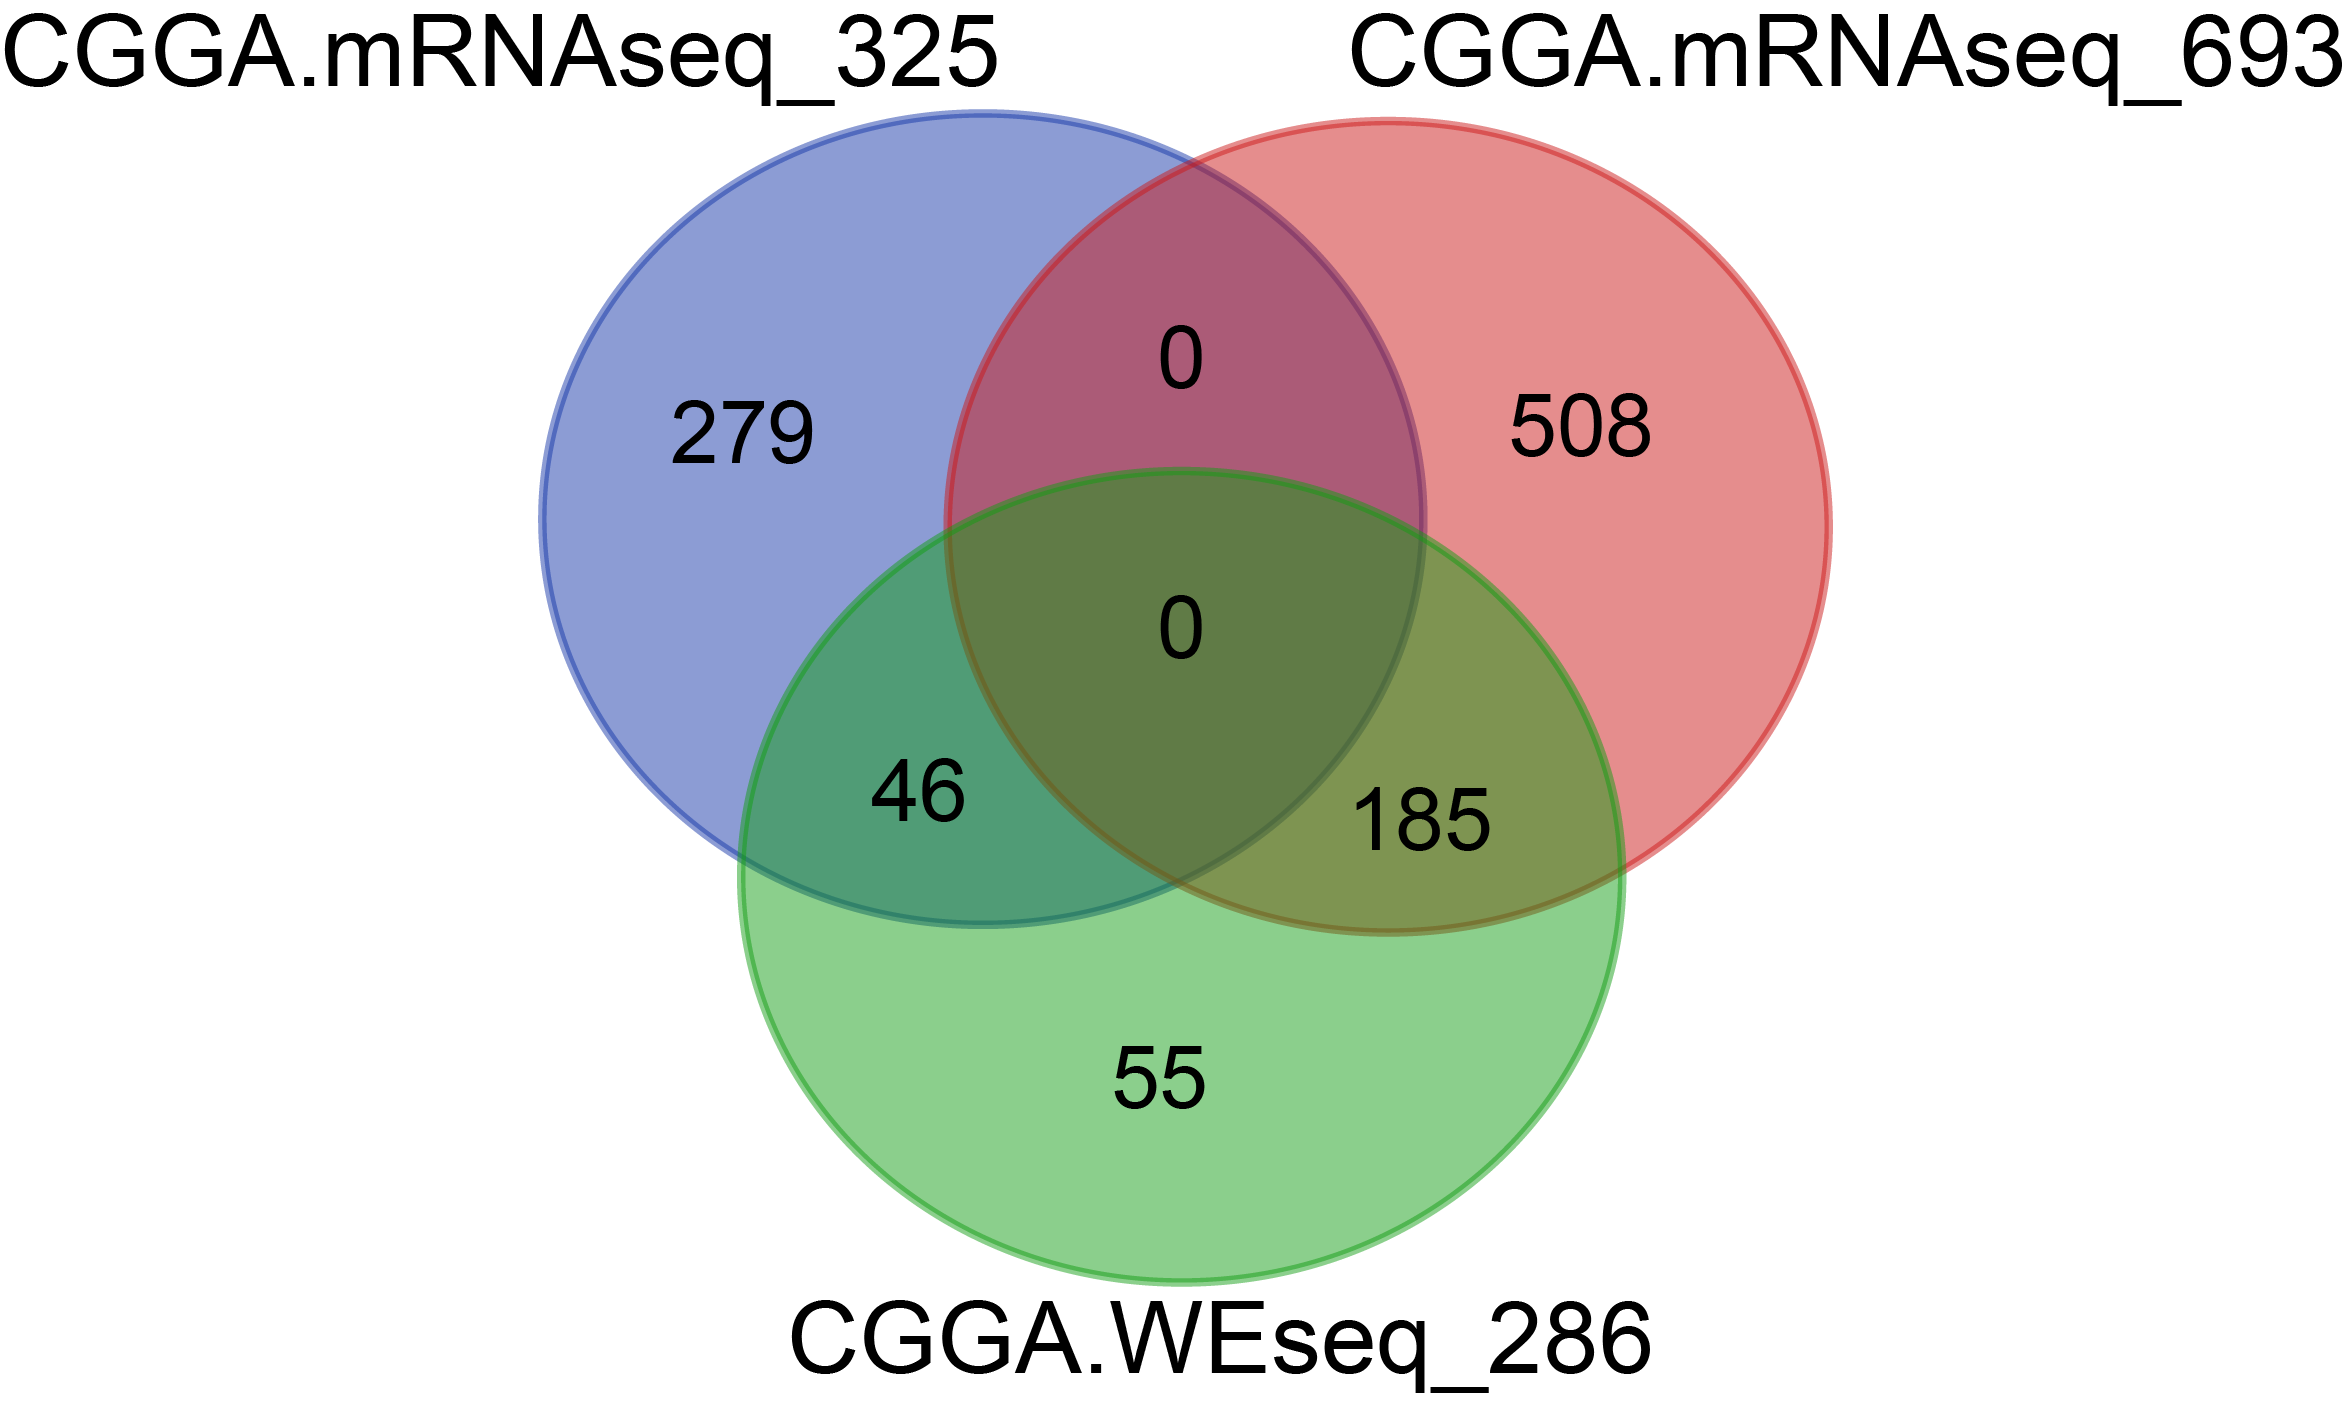
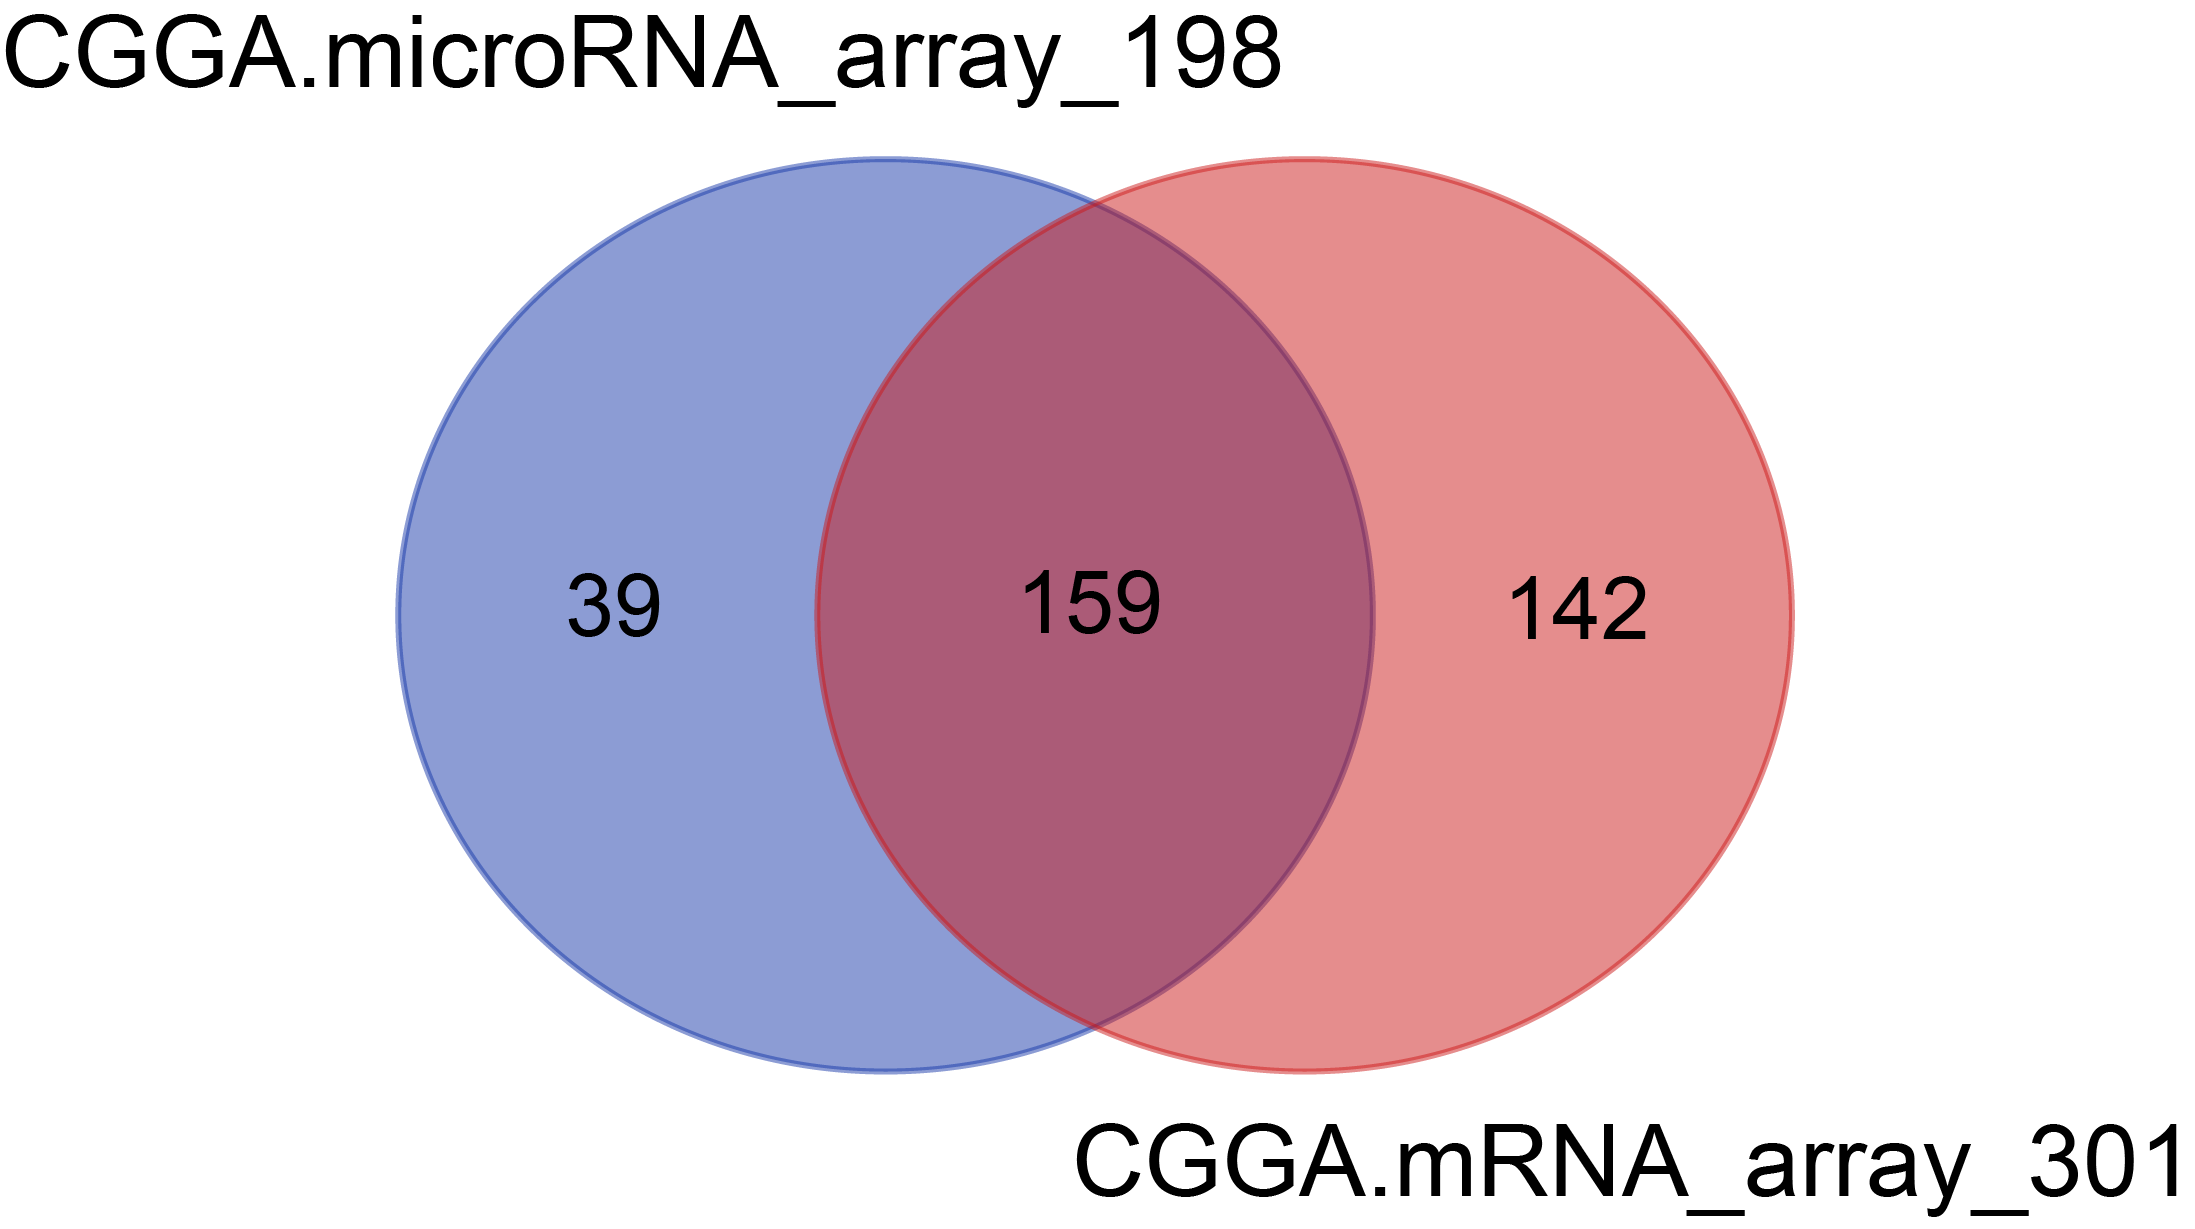
There were 301 samples for mRNA microarray detection, 198 samples for microRNA microarray detection, among which 159 samples overlapped with mRNA and microRNA data.